Lessons From Capital Market History
Chapter 12
Created by David Moore, PhD
Topics
- Historical returns
- First Lesson: Average Returns
- Risk Premium
- Second Lesson: Variability of Returns
- Arithmetic vs Geometric Returns
- Capital Market Efficiency
Overview: Risk, Return and Financial Markets
- Lessons from capital market history
- There is a reward for bearing risk
- The greater the potential reward, the greater the risk
- This is called the risk-return trade-off
How should we measure risk and return?
First Lesson: Average Return
Historical Record
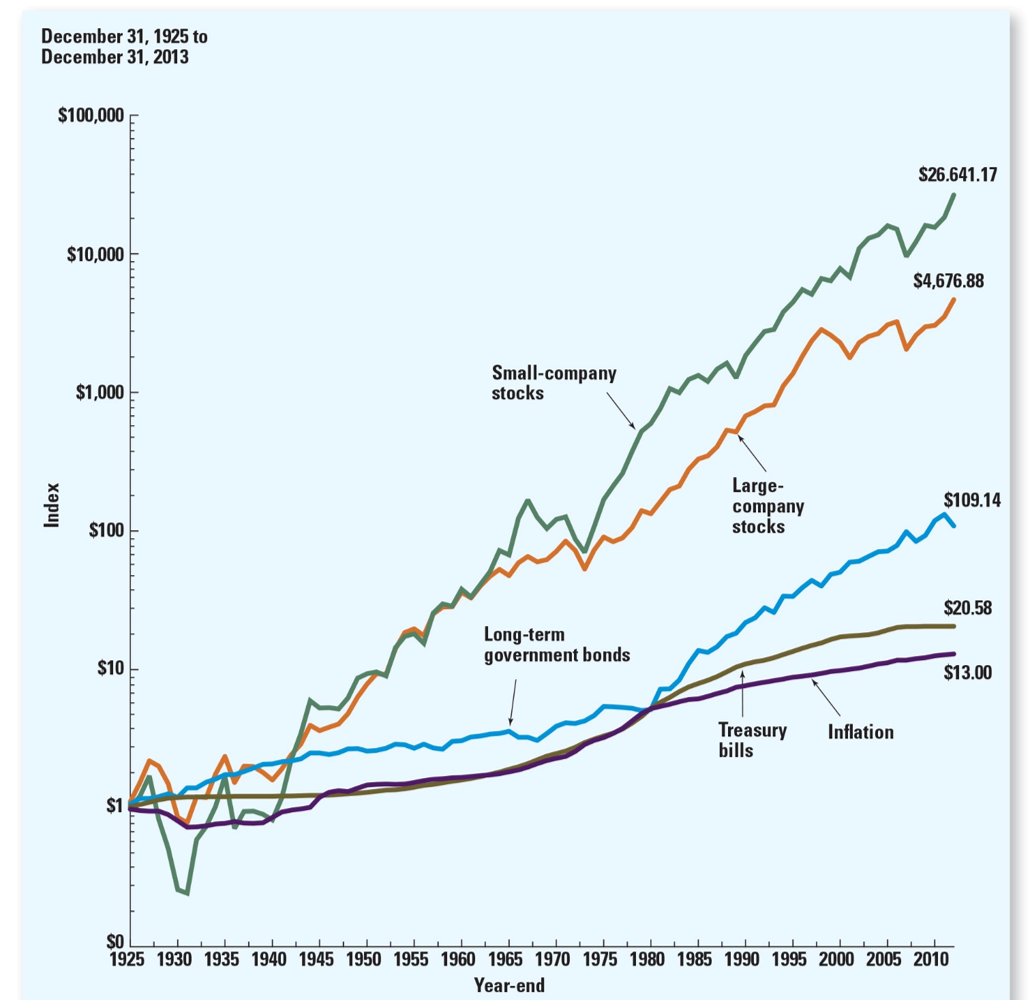
Ranking Returns
- Small cap stocks
- Large cap stocks
- Long-term government bonds
- Treasury Bills
- Inflation
Why wouldn't you just buy small cap stocks?
Calculating Returns
- Total Dollar Return
- $Return = Dividends + Capital Gains
- Total Percent Return
- %Return = $\frac{\$Return}{\$Invested}$
Example: Returns
You just invested in "You call that a Donut! Inc" for $\$$25, after one-year the price is $\$$35. Each share paid out a $\$$2 dividend. What was your total return?| Dollar Return | Percent Return | |
|---|---|---|
| Dividend | 2 | $\frac{2}{25}=8\%$ |
| Capital Gains | 35-25=10 | $\frac{35-25}{25}=40\%$ |
| Total Return | 2+10=12 | $\frac{10+2}{25}=48\%$ |
Percent Returns: Formulas
Dividend Yield$DY=\frac{D_{t+1}}{P_t}$
Capital Gains Yield
$CGY=\frac{P_{t-1}-P_t}{P_t}$
$\%Return=\frac{D_{t+1}+P_{t+1}-P_t}{P_t}$
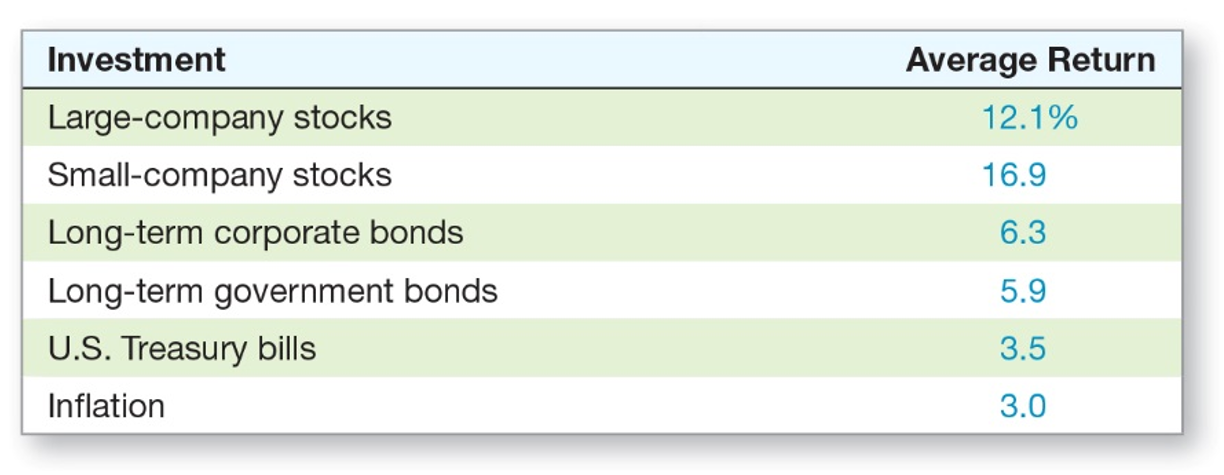
Historical Average Returns
$HistoricalAverageReturn=\frac{\sum\limits_{i=1}^TReturn_i}{T}$
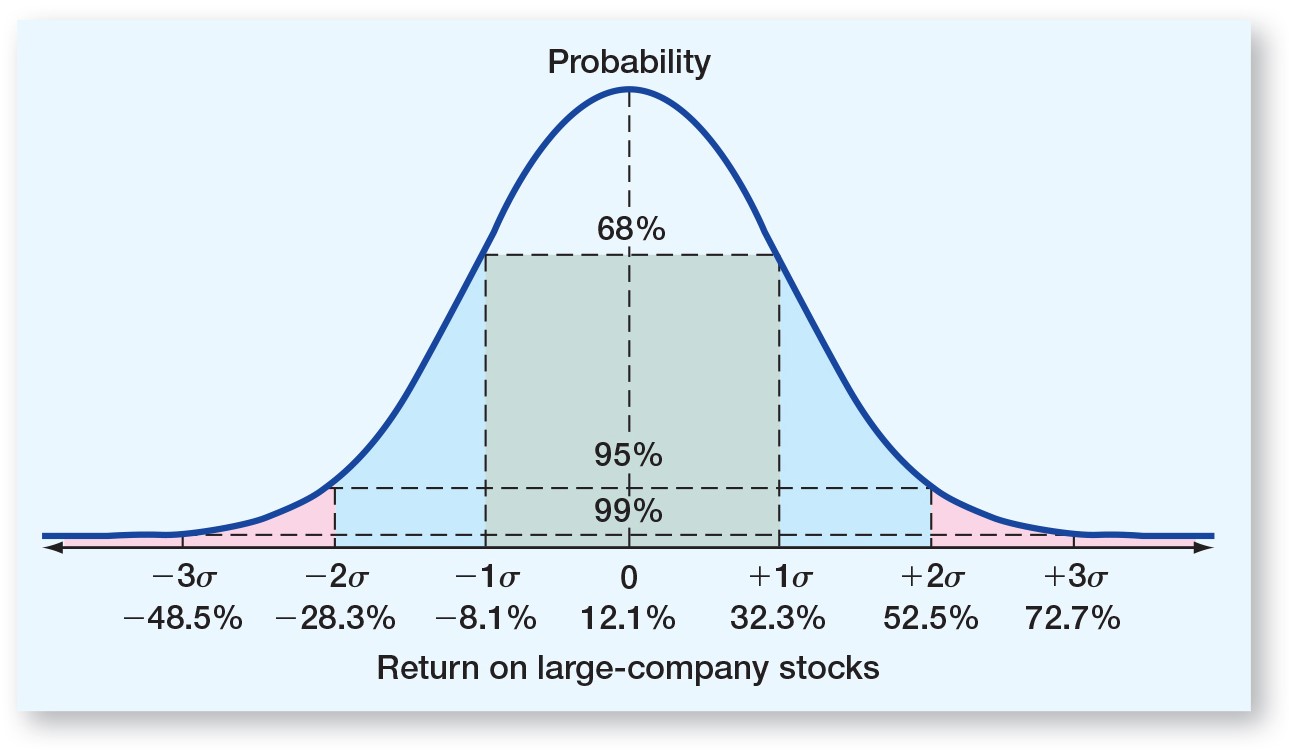
Large cap stocks average return from 1926 to 2010: 11.9%
Your best guess about the size of the return for a year selected at random is 11.9%.
Historical Average Returns: 1926-2010
Practice: Average
Returns: -6, 8, 12, -15, 6Average = 1
Returns: -1, 2, -1, 1, 4
Average = 1
Risk Premium
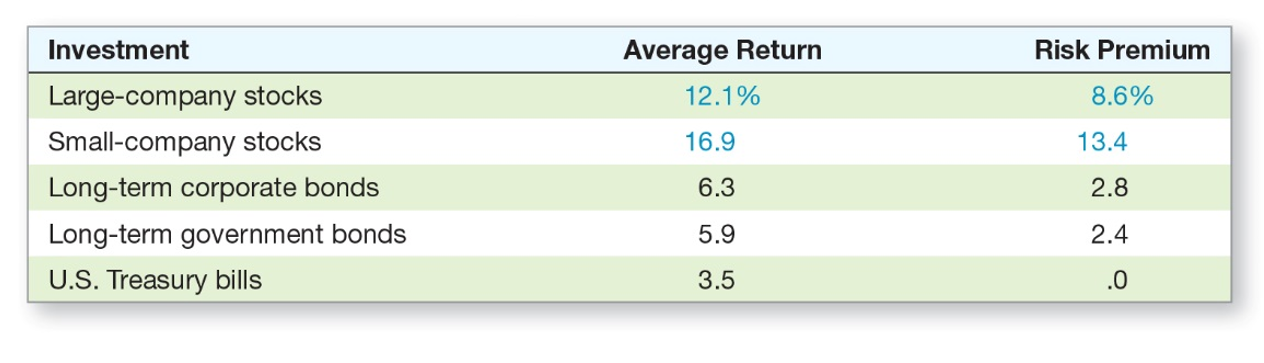
U.S. Treasury bill is considered risk-free return
Historical Average Risk Premium
First Lesson Takeaways
Large company stocks have a historical average risk premium of 8.6%
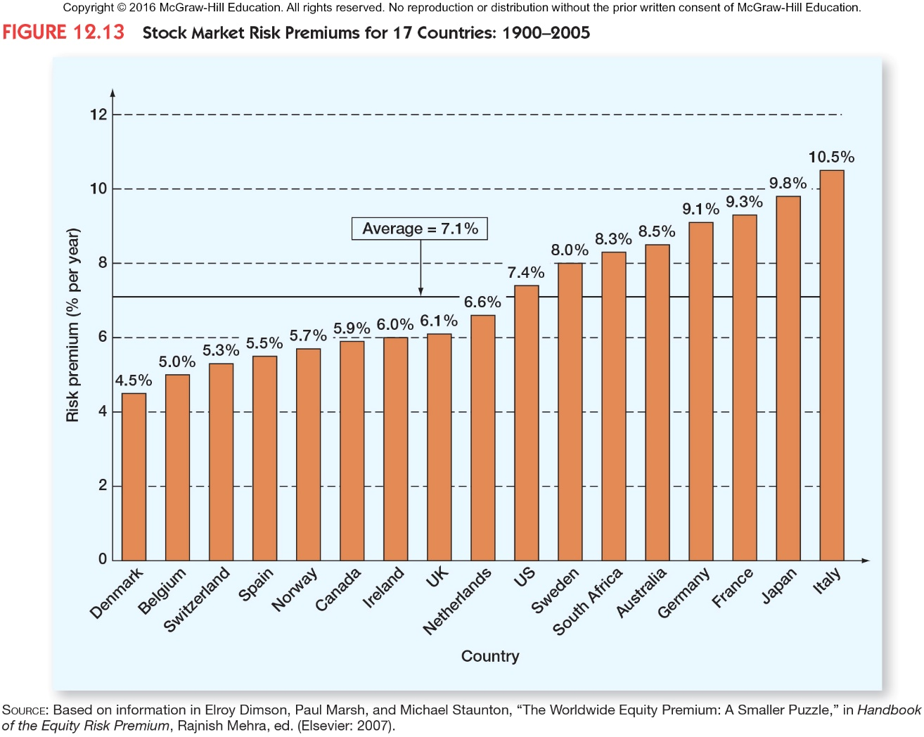
What determines size of risk premium?
Second Lesson: Return Variability
Measuring Return Variability
- Variance or $\sigma^2$
- Common measure of return dispersion
- Standard deviation or $\sigma$
- Sometimes called volatility
- Same "units" as the average
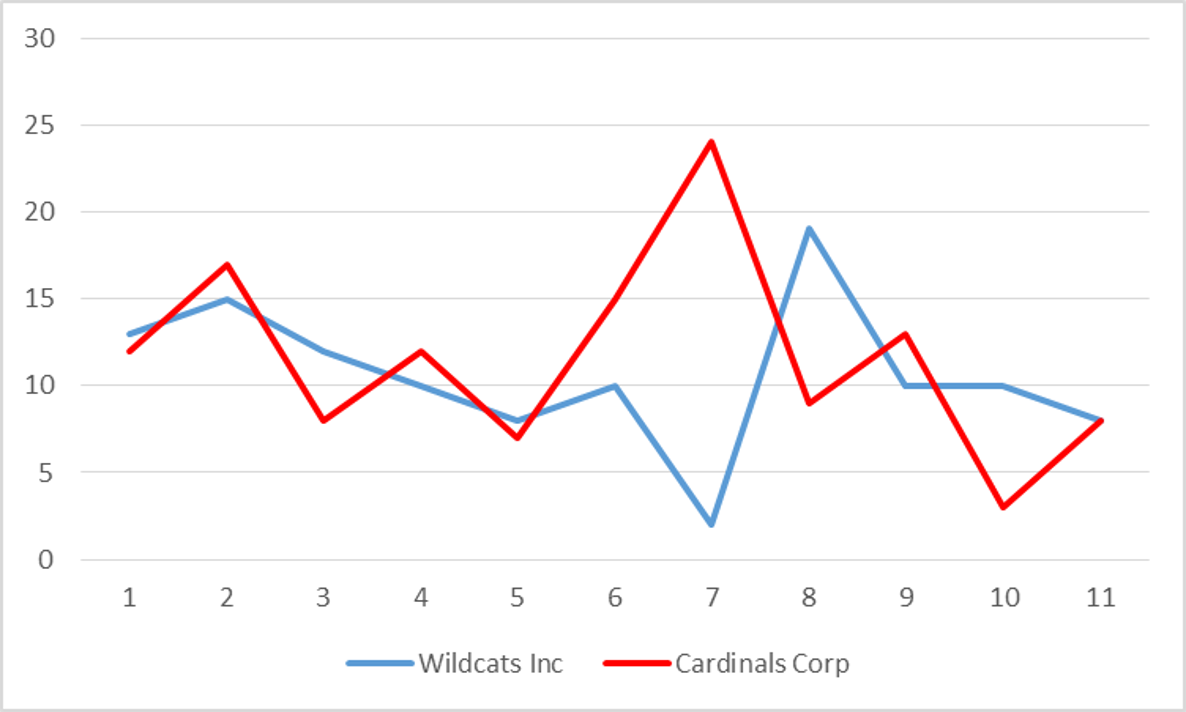
Example
Two companies have the following returns:Wildcat Inc: 13,15,12,10,8,10,2,19,10,10,8
Cardinals Corp: 12,17,8,12,7,15,24,9,13,3,8
| Wildcats Inc. | Cardinals Corp. | |
|---|---|---|
| Average | 10.6 | 11.6 |
| Standard Deviation | 4.3 | 5.7 |
Graphical Representation
Steph vs LeBron (Points in 2016 Playoffs)
Steph Curry (9 games leading into finals):40,29,26,28,24,19,31,31,36.LeBron James (9 games leading into finals):27,24,21,24,23,24,29,23,33.
| Steph | LeBron | |
|---|---|---|
| Average | 29.33 | 25.33 |
| Standard Deviation | 6.25 | 3.71 |
Return Variability
- Return Variance:
$VAR(R)=\sigma^2=\frac{\sum\limits_{i=1}^T(R_i-\bar{R})^2}{T-1}$
- Standard deviation:
$STD(R)=\sigma=\sqrt{VAR(R)}$
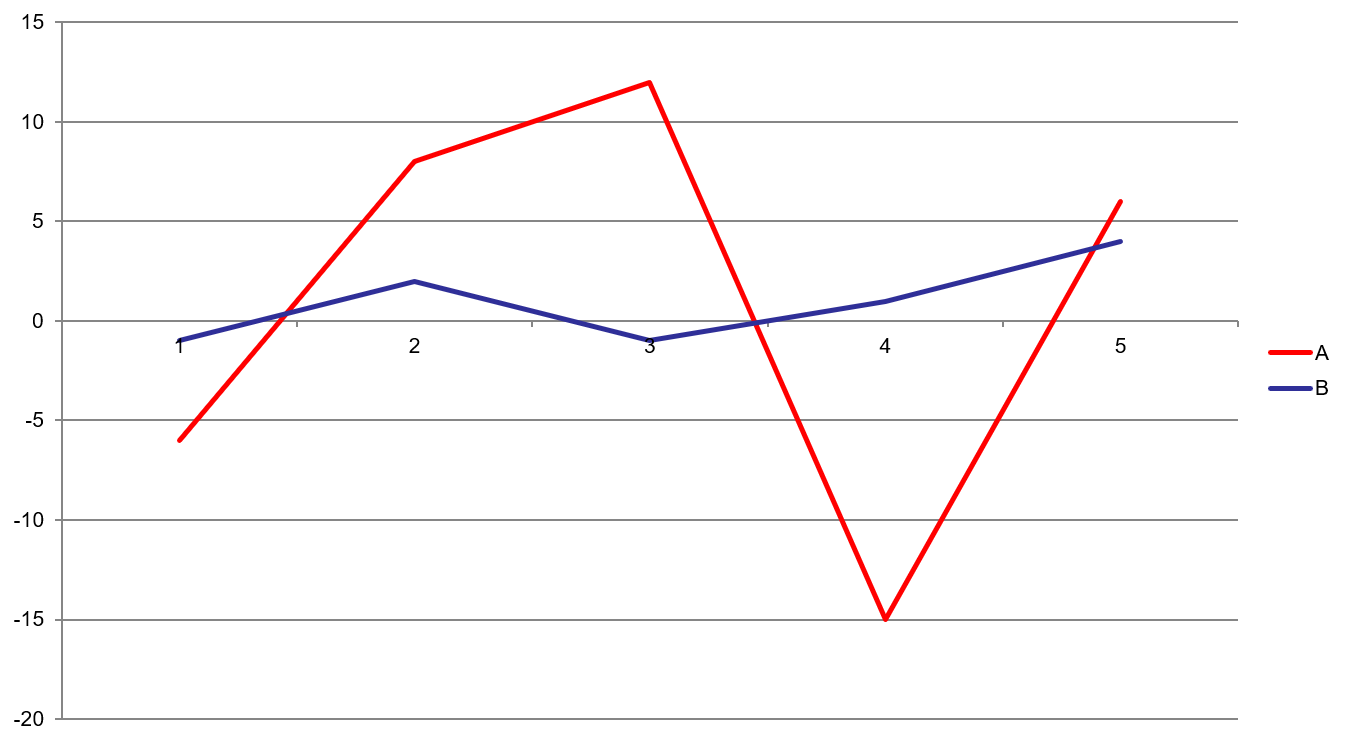
Practice: Standard Deviation
Returns(A): -6, 8, 12, -15, 6Average = 1
Standard deviation = 11.18
Returns(B): -1, 2, -1, 1, 4
Average = 1
Standard deviation = 2.12
Graphing Returns
Example
| Year | Return (%) | Average Return (%) | Difference | Squared Difference |
|---|---|---|---|---|
| 1926 | 11.14 | 11.48 | -.034 | 0.0012 |
| 1927 | 37.13 | 11.48 | 25.65 | 657.82 |
| 1928 | 43.31 | 11.48 | 31.83 | 1013.02 |
| 1929 | -8.91 | 11.48 | -20.39 | 415.83 |
| 1930 | -25.26 | 11.48 | -36.74 | 1349.97 |
| Variance | 859.19 | |||
| Standard Deviation | 29.31 |
Normal Distribution
Arithmetic vs. Geometric Mean
Think about returns...
If you invest in a hedge fund that loses 20% the first year, but makes 20% the second year, are you back to even?- NO!!!!!
- Start with $\$$100
- After year 1: you have $\$$80
- After year 2, you have $96
Another example
Suppose you invest $\$$100 and it falls 50% in year one but gain 100% in year 2.- Year 0:100
- Year 1:100*(1-0.50)=50
- Year 2:50*(1+1)=100
Arithmetic vs. Geometric Mean
- Arithmetic average:
- Return earned in an average period over multiple periods
- Answers the question: "What was your return in an average year over a particular period?"
- Geometric average
- Average compound return per period over multiple periods
- Answers the question: "What was your average compound return per year over a particular period?"
Geometric average < Arithmetic average unless all the returns are equal
Geometric Average: Formula
$GAR=[(1+R_1)*(1+R_2)*...*(1+R_T)]^{\frac{1}{T}}-1$
Where:
$R_i$= return in each period
$T$ = number of periods
Geometric Average: Formula
$GAR=[\prod\limits_{i=1}^T(1+R_i)]^{\frac{1}{T}}-1$
Where:
$\prod$= Symbol for product (multiply)
$R_i$= return in each period
$T$ = number of periods in sample
Revisit Examples
If you invest in a hedge fund that loses 20% the first year, but makes 20% the second year.Average Return: 0%
Geometric return: -2.02%
Suppose you invest $\$$100 and it falls 50% in year one but gain 100% in year 2.
Average Return: 25%
Geometric Return: 0%
Example
| Year | Return (%) | (1+R) | Compounded |
|---|---|---|---|
| 1926 | 11.14 | 1.114 | 1.114 |
| 1927 | 37.13 | 1.3713 | 1.5241 |
| 1928 | 43.31 | 1.4331 | 2.1841 |
| 1929 | -8.91 | 0.9109 | 1.9895 |
| 1930 | -25.26 | 0.7474 | 1.4870 |
| $(1.4870)^\frac{1}{5}$ | 1.0826 | ||
| Geometric return | 8.26% |
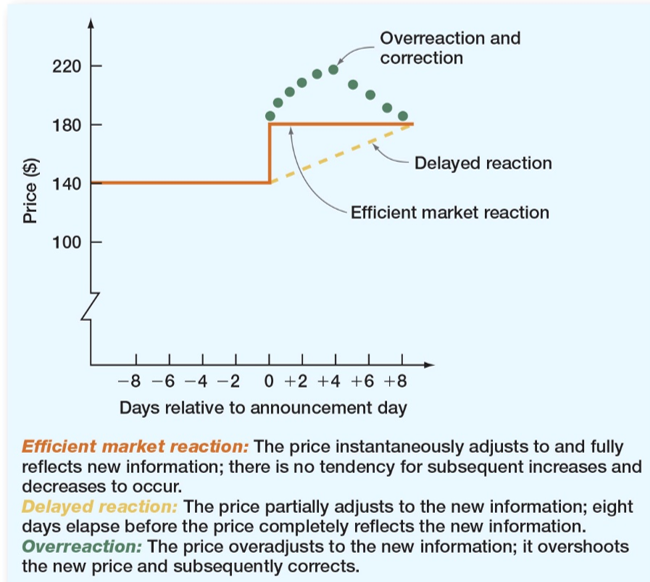
Capital Market Efficiency
Capital Market Efficiency
If true, cannot earn abnormal or excess returns.
Efficient Market Hypothesis
- Idea is competition among investors drives information into prices and thus the market becomes more and more efficient.
- Stocks are all priced correctly
Finance version of "Dad Joke"
A student and a finance professor are walking down the hall when they both see a $\$$20 bill on the ground. The student bends down to pick it up.The professor shakes their head slowly with a look of disappointment. And says…
"Don't bother, If it were really there, someone else would have picked it up already"
Forms of Market Efficiency
- Strong form: all information of every kind is reflected in the stock prices. Including public and private.
- Semi-strong form: all public information is reflected in stock prices.
- Weak form: Prices reflect all past trading information such as prices and volume.
Summary
- No simple way to "beat" the market
- Identifying mispriced stocks is very difficult (borderline impossible)
- Prices do respond rapidly to information
- Very difficult to predict future stock prices
Extra Practice
Example 1
One year ago, Avril purchased 3,600 shares of Lavigne stock for $\$$101,124. Today, she sold those shares for $\$$26.60 a share. What is the total return on this investment if the dividend yield is 1.7 percent?Example 2
A stock has yielded returns of 6 percent, 11 percent, 14 percent, and -2 percent over the past 4 years, respectively. What is the standard deviation of these returns?Example 3
You purchased 1,300 shares of LKL stock 5 years ago and have earned annual returns of 7.1 percent, 11.2 percent, 3.6 percent, -4.7 percent and 11.8 percent. What is your arithmetic average return?What is the geometric return?Key Learning Outcomes
- First Lesson: Average Returns
- Historical returns
- Risk Premium
- Second Lesson: Return Variability
- Standard deviation
- Arithmetic vs Geometric return
- Capital market efficiency
- Efficient market hypothesis