Return, Risk, and the Security Market Line
Chapter 13
Created by David Moore, PhD
Topics
- Expected Returns and Variances
- Portfolios
- Diversification
- Total, systematic, unsystematic risk
- Beta
- Reward-to-risk Ratio
- Security Market Line
- CAPM
Expected Returns and Variances
Weighted Average Reminder
Your grade is weighted 30% for the midterm 50% for the final. Homework is worth 10% and quizzes another 10%. You did perfect on the homework and quizzes. The midterm you received a 81 and the final was an 92. What is your final grade?Answer: 90.3
Expected Returns
- Expected returns are based on the probabilities of possible outcomes
- In this context, "expected" means average if the process is repeated many times
- The "expected" return does not even have to be a possible return
$E(R)=\sum\limits_{i=1}^Np_iR_i$
Example: E(R)
Suppose you have predicted the following returns for stocks C and T in three possible states of the economy. What are the expected returns?| State | Probability | C | T |
|---|---|---|---|
| Boom | 0.3 | 0.15 | 0.25 |
| Normal | 0.5 | 0.1 | 0.2 |
| Recession | ??? | 0.02 | 0.01 |
| Expected Return | 9.9% | 17.7% |
Variance and Standard Deviation
- Variance and standard deviation measure the volatility of returns
- Using unequal probabilities for the entire range of possibilities
- Weighted average of squared deviations
$\sigma^2=\sum\limits_{i=1}^np_i(R_i-E(R))^2$
Example
| State | $P_i$ | C | T | $p_i(R_i-E(R))^2$ | $p_i(R_i-E(R))^2$ |
|---|---|---|---|---|---|
| Boom | 0.3 | 0.15 | 0.25 | $0.3(0.15-0.099)^2$ | $0.3(0.25-0.177)^2$ |
| Normal | 0.5 | 0.1 | 0.2 | $0.5(0.1-0.099)^2$ | $0.5(0.2-0.177)^2$ |
| Recession | 0.2 | 0.02 | 0.01 | $0.2(0.02-0.099)^2$ | $0.2(0.01-0.177)^2$ |
| $\sigma^2$ | 0.002029 | 0.007441 | |||
| $\sigma$ | 4.50% | 8.63% |
Portfolios
What is a portfolio?
- A portfolio is a collection of assets
- An asset's risk and return are important in how they affect the risk and return of the portfolio
- The risk-return trade-off for a portfolio is measured by the portfolio expected return and standard deviation, just as with individual assets
Portfolio Weights
Suppose you have $\$$15,000 to invest and you have purchased securities in the following amounts. What are your portfolio weights in each security?| Portfolio | Weights |
|---|---|
| $\$$2000 of DIS | 2/15=13.33% |
| $\$$3000 of KO | 3/15=20% |
| $\$$4000 of AAPL | 4/15=26.7% |
| $\$$6000 of PG | 6/15=40% |
Portfolio Expected Return
$E(R_p)=\sum\limits_{j=1}^mw_jE(R_j)$
- You can also find the expected return by finding the portfolio return in each possible state and computing the expected value as we did with individual securities
Example
| Stock | Weight | Return | $w_jE(R_j)$ |
|---|---|---|---|
| DIS | .1333 | 19.69% | 2.62% |
| KO | .20 | 5.25% | 1.05% |
| AAPL | .267 | 16.65% | 4.45% |
| PG | .40 | 18.24% | 7.30% |
| $E(R_p)$ | 15.41% |
Portfolio Variance
- Compute the portfolio return for each state.
- Compute the expected portfolio return using the same formula as for an individual asset.
- Compute the portfolio variance and standard deviation using the same formulas as for an individual asset.
Example
| State | $P_i$ | A (50%) | B (50%) | $E(R_p)$ | $p_i(E(R_j)-E(R_p))^2$ |
|---|---|---|---|---|---|
| Boom | .4 | 30% | -5% | 12.5% | $.4(12.5-9.5)^2=3.6$ |
| Bust | .6 | -10% | 25% | 7.5% | $.6(7.5-9.5)^2=2.4$ |
| $E(R_i)$ | 6% | 13% | $E(R_p)$9.5% | $\sigma_p^2$=6 | |
| $\sigma_i^2$ | 384 | 216 | $\sigma_p$=2.45% | ||
| $\sigma_i$ | 19.6% | 14.7% |
Note: You CANNOT use stock level $\sigma^2$ and $\sigma$ to calculate portfolio.
Risk, Return, and Diversification
Systematic Risk
- Risk factors that affect a large number of assets
- Also known as non-diversifiable risk or market risk
- Includes such things as changes in GDP, inflation, interest rates, etc.
Unsystematic Risk
- Risk factors that affect a limited number of assets
- Also known as unique risk and asset-specific risk
- Includes such things as labor strikes, part shortages, etc.
Returns
$Total Return = Expected Return + Unexpected Return$$Unexpected Return = Systematic Portion $
$+ Unsystematic Portion$
$Total Return= Expected Return + Systematic Portion$
$+ Unsystematic Portion$
Diversification
- Diversification is not just holding a lot of assets
- For example, if you own 50 Internet stocks, you are not diversified
- However, if you own 50 stocks that span 20 different industries, then you are diversified
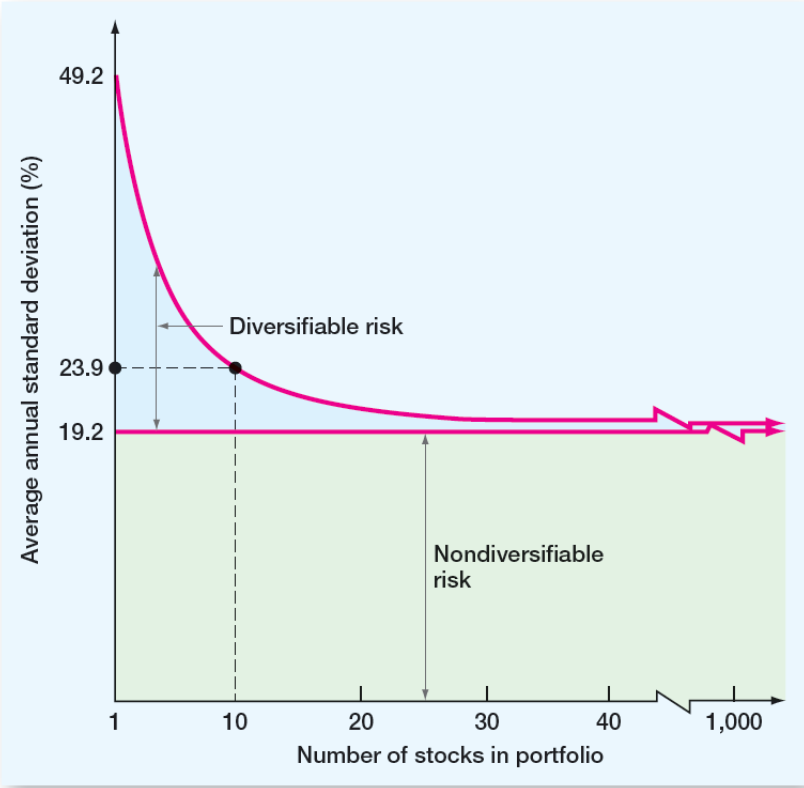
The Principle of Diversification
- Diversification can substantially reduce the variability of returns without an equivalent reduction in expected returns
- This reduction in risk arises because worse than expected returns from one asset are offset by better than expected returns from another
- However, there is a minimum level of risk that cannot be diversified away and that is the systematic portion
Diversifiable vs Non-Diversifiable Risk
Diversifiable Risk
- The risk that can be eliminated by combining assets into a portfolio
- Often considered the same as unsystematic, unique or asset-specific risk
- If we hold only one asset, or assets in the same industry, then we are exposing ourselves to risk that we could diversify away
Total Risk
- The standard deviation of returns is a measure of total risk
- For well-diversified portfolios, unsystematic risk is very small
- Consequently, the total risk for a diversified portfolio is essentially equivalent to the systematic risk
Systematic Risk Principle
Measuring Systematic Risk
- How do we measure systematic risk?
- We use the beta coefficient
- What does beta tell us?
- A beta of 1 implies the asset has the same systematic risk as the overall market
- A beta < 1 implies the asset has less systematic risk than the overall market
- A beta > 1 implies the asset has more systematic risk than the overall market
Current Beta's
Total vs. Systematic Risk
Consider the following information:| Standard Deviation | Beta | |
|---|---|---|
| Marathon Oil | 20% | 3.13 |
| Exxon Mobil | 30% | 0.69 |
- Which security has more total risk? Exxon Mobil
- Which security has more systematic risk? Marathon Oil
- Which security should have the higher expected return? Marathon Oil
Portfolio Beta
Consider the previous example with the following four securities| Security | Weight | Beta |
|---|---|---|
| DIS | .133 | 1.444 |
| KO | .2 | 0.797 |
| AAPl | .267 | 1.472 |
| PG | .4 | 0.647 |
What is the portfolio beta?
.133(1.444) + .2(0.797) + .267(1.472) + .4(0.647) = 1.003
Portfolio Expected Returns and Betas
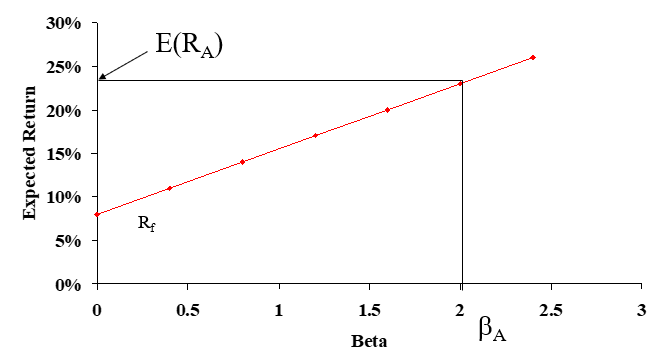
Reward-to-Risk Ratio
- The reward-to-risk ratio is the slope of the line illustrated in the previous example
- $Slope=\frac{E(R_A)-R_f}{\beta_A-0}$
- From graph, $Slope=\frac{23-8}{2-0}=7.5$
- What if an asset has a reward-to-risk ratio of 8 (implying that the asset plots above the line)?
- What if an asset has a reward-to-risk ratio of 7 (implying that the asset plots below the line)?
Market Equilibrium
$\frac{E(R_A)-R_f}{\beta_A}=\frac{E(R_M)-R_f}{\beta_M}$
Security Market Line
- The security market line (SML) is the representation of market equilibrium
- The slope of the SML is the reward-to-risk ratio: $\frac{E(R_M)-R_f}{\beta_M}$
- But since the beta for the market is always equal to one, the slope can be rewritten
- Slope $=E(R_M) – R_f =$ market risk premium
Put it all together...
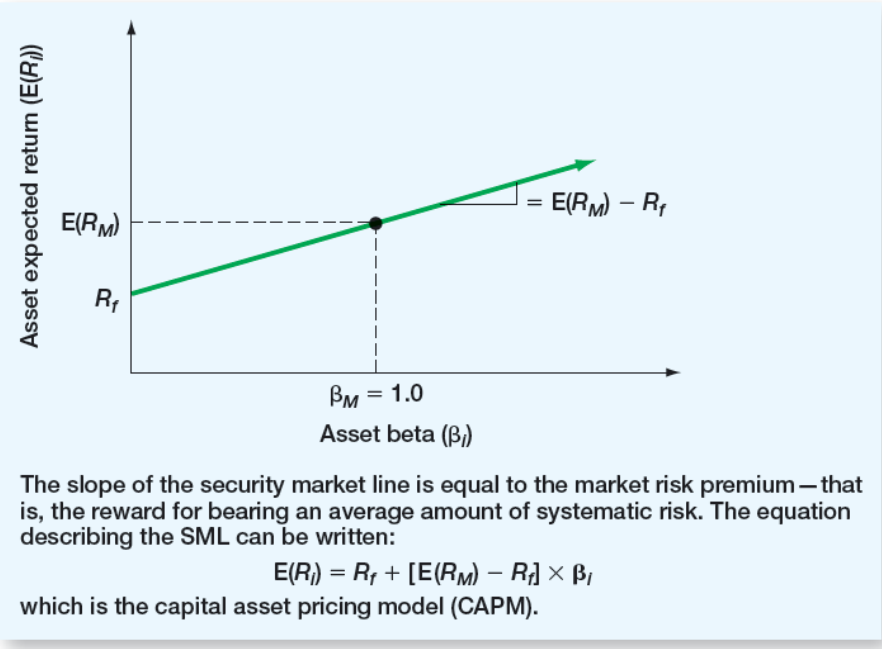
The Capital Asset Pricing Model (CAPM)
$E(R_i)=R_f+\beta_i(E(R_M)-R_f)$
- If we know an asset's systematic risk, we can use the CAPM to determine its expected return
- This is true whether we are talking about financial assets or physical assets
Factors Affecting Expected Return
- Pure time value of money: measured by the risk-free rate
- Reward for bearing systematic risk: measured by the market risk premium
- Amount of systematic risk: measured by beta
CAPM: Example
Consider the betas for each of the assets given earlier. If the risk-free rate is 4.15% and the market risk premium is 8.5%, what is the expected return for each?| Asset | Beta | $E(R_i)$ |
|---|---|---|
| DIS | 1.444 | 4.15 + 1.444(8.5) = 16.42% |
| KO | 0.797 | 4.15 + 0.797(8.5) = 10.92% |
| AAPL | 1.472 | 4.15 + 1.472(8.5) = 16.66% |
| PG | 0.647 | 4.15 + 0.647(8.5) = 9.65% |
Extra Practice
Example 1
What is the expected return, variance, and standard deviation?| State | Probability | Go Nuts for Donuts Inc. |
|---|---|---|
| Boom | .25 | .15 |
| Normal | .5 | .08 |
| Slowdown | .15 | .04 |
| Recession | .10 | -.03 |
Example 2
Consider the following information on returns and probabilities:| State | Probability | Apple | Disney |
|---|---|---|---|
| Boom | .25 | 15% | 10% | Normal | .6 | 10% | 9% |
| Recession | .15 | 5% | 10% |
What are the expected return and standard deviation for a portfolio with an investment of $\$$6,000 in Apple and $\$$4,000 in Disney?
Example 3
The risk free rate is 4%, and the required return on the market is 12%.- What is the required return on an asset with a beta of 1.5?
- What is the reward/risk ratio?
- What is the required return on a portfolio consisting of 40% of the asset above and the rest in an asset with an average amount of systematic risk?
Key Learning Outcomes
- Calculate:
- Expected return, variance, and standard deviation
- Do so for a portfolio of assets
- Understand diversification
- Total risk, Systematic risk, Unsystematic risk
- Beta, Security Market Line and CAPM
- Understand concept and derivation
- Calculate Portfolio Beta
- Use CAPM