Financial Statement Analysis
Created by David Moore, PhD
Reference Material: Wall Street Prep Accounting Crash Course (Chapter 51)Key Concepts
- Common-size Financial Statements
- Vertical vs Horizontal
- Financial Ratios
- Dupont Identity
- Benchmarking
- Issues with analyzing financial statements
What Is Financial Statement Analysis?
- External: Understand overall health
- Internal: Monitoring tool
General Issue
How do we compare Financial Statements?- Size is a major issue
- Solution
- Standardize financial statements
- Vertical
- Horizontal
- Financial Ratios
Common-Size Statements
- Balance Sheet
- Vertical:Express as a percent of total assets
- Horizontal:Express as a percent of base or last year
- Income Statement
- Vertical:Express as a percent of Sales
- Horizontal:Express as a percent of base or last year
- Vertical: Within same period for the same company
- Horizontal:Across reporting periods (base-year or growth)
Common Size Balance Sheet
Vertical Analysis
| 2017 | 2018 | Common-Size | |
|---|---|---|---|
| Cash | 84 | 146 | 146/3636=4.0% |
| A/R | 165 | 188 | 188/3636=5.2% |
| Inventory | 393 | 422 | 422/3636=11.6% |
| PPE | 2731 | 2880 | 2880/3636=79.2% |
| Total Assets | 3373 | 3636 | 3636/3636=100% |
Common Size Balance Sheet
Horizontal Analysis
| 2017 | 2018 | Common-Size | |
|---|---|---|---|
| Cash | 84 | 146 | 146/84-1=73.8% |
| A/R | 165 | 188 | 188/165-1=13.9% |
| Inventory | 393 | 422 | 422/393-1=7.4% |
| PPE | 2731 | 2880 | 2880/2731-1=5.5% |
| Total Assets | 3373 | 3636 | 3636/3373-1=7.8% |
Common Size Income Statement
Vertical Analysis
| 2018 | Common-Size | |
|---|---|---|
| Sales | 2311 | 2311/2311=100.0% |
| Cost of Goods Sold | 1344 | 1344/2311=58.2% |
| Depreciation | 276 | 276/2311=11.9% |
| EBIT | 691 | 691/2311=29.9% |
| Net Interest Expense | 141 | 141/2311=6.1% |
| Taxable Income | 550 | 550/2311=23.8% |
| Taxes | 116 | 116/2311=5.0% |
| Net Income | 435 | 435/2311=18.8% |
What the Common-Size Reveals
- Large or drastic changes
- Strategy
- Used as part of Overall Financial statement analysis
Caveats
- Quarterly Data and Horizontal
- Use same fiscal quarter
- Horizontal can be misleading due to base year selection
- Best if Vertical and horizontal are used in conjunction.
- Can also compare intra-industry
Ratio Analysis
Overview
- Why study ratios?
- There are a lot of financial ratios; CFA exam has 40!
- We will cover commonly used ratios
- Not all ratios created from same data, i.e., be careful!
Takeaway: It is trivial to calculate ratios, I want you to
Ask Yourself
- How is the ratio computed?
- What is the ratio trying to measure and why?
- What is the unit of measurement?
- Does the sign make sense?
- What does the value indicate?
- How can we improve the company's ratio?
Ratio Types
- Liquidity or Short-term solvency
- Asset Management or Turnover
- Financial leverage or Long-term Solvency
- Performance
- Profitability
- Market Value
Click here for a full list and description of financial ratios.
Short-term solvency
$Current Ratio=\frac{Current Assets}{Current Liabilities}$
$Quick Ratio=\frac{Current Assets - Inventory}{Current Liabilities}$
$Cash Ratio=\frac{Cash}{Current Liabilities}$
$Interval Measure=\frac{CA}{Average Daily Operating Costs}$
This is just a sample of ratios for this category
Asset Management
$Inventory Turnover=\frac{Cost of Goods Sold}{Inventory}$
$Days' Sales In Inventory=\frac{365 days}{Inventory Turnover}$
This is just a sample of ratios for this category
Long-term Solvency
$Total Debt Ratio=\frac{Total Assets - Total Equity}{Total Assets}$
$Debt\text{-}Equity Ratio=\frac{Total Debt}{Total Equity}$
$Equity Multiplier=\frac{Total Assets}{Total Equity}$
$Cash Coverage Ratio=\frac{EBIT + Depreciation}{Interest}$
Sidenote: Typically analysts are only concerned with long-term debt.
This is just a sample of ratios for this category
Performance: Profitability
$Profit Margin=\frac{Net Income}{Sales}$
$Return on Equity(ROE)=\frac{Net Income}{Total Equity}$
$Return on Assets(ROA)=\frac{Net Income}{Total Assets}$
This is just a sample of ratios for this category
Performance: Market
$Earnings Per Share=\frac{Net Income}{Shares Outstanding}$
$PE Ratio=\frac{Price Per Share}{Earnings Per Share}$
$Market\text{-}To\text{-}Book Ratio=\frac{Market Value}{Book Value}$
This is just a sample of ratios for this category
Enterprise value
$Enterprise Value=Market Cap + Book Value Of Liabilities - Cash$
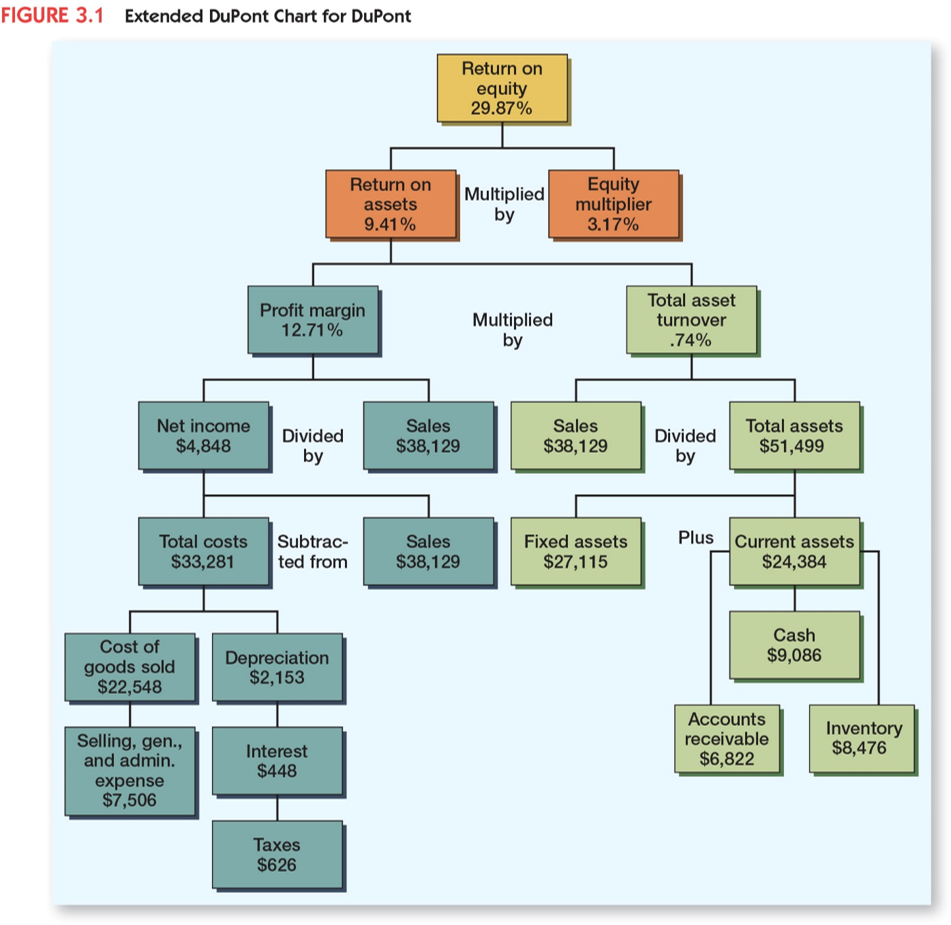
Dupont Identity
$ROE=Profit Margin \text{ x } Total Asset Turnover \text{ x } Equity Multiplier$
Why analyze financial statements?
- Market data can be difficult to get
- Comparison tool: Internal vs external uses
Benchmarking
Ratio in isolation does not paint entire picture, therefore; compare to "something". Benchmarking is finding that something.
Common Benchmarks
- Time trend analysis (Horizontal)
- Peer group analysis (Vertical/Intra Industry)
SIC Codes

Issues/Concern with Financial Statements Analysis
- No theory
- Conglomerates
- Globalization
- Different accounting procedures
- Fiscal-year ends and seasonality
- One-time events
Financial Statement Analysis in practice

Ratios Tell A Story
California Choppers Case
Key Learning Outcomes
- Common-size: vertical vs horizontal
- Financial Ratios!!! Calculate and
interpret. - Dupont Identity
- Benchmarking
- Issues with analysis