Financial Statements, Taxes, and Cash Flow
Chapter 2
Created by David Moore, PhD
Key Concepts
Note: This chapter is largely a review of key accounting concepts.
- Balance sheet
- Income statement
- Taxes
- Cash flow
Financial Statements
- Mandatory
- Public
- Large set of reporting rules
- Most useful source of information on public companies.
The Balance Sheet
Balance Sheet
Balance Sheet Identity:
- Assets= Liabilities + Stockholder's Equity
Summarizes what the firm owns (assets), owes (liabilities), and the difference (stockholder's equity).
| Assets | Liabilities | ||
|---|---|---|---|
| Current Assets | Current Liabilities | ||
| Cash | 1,500 | Accounts Payable | 600 |
| Accounts Receivable | 500 | Notes Payable | 300 |
| Inventory | 750 | ||
| Total | 2,750 | Total | 900 |
| Fixed Assets | |||
| Property Plant and Equipment | 5,000 | Long-term Debt | 3,500 |
| Shareholders' Equity | |||
| Common stock and paid-in surplus | 1,000 | ||
| Retained Earnings | 2,350 | ||
| Total | 3,350 | ||
| Total Assets | 7,750 | Total Liabilities + Shareholders' Equity | 7,750 |
Asset Tangibility
Assets can be
Things to consider
- Liquidity
- Debt vs Equity
- Market Value vs Book Value
Liquidity
Trade off:
- Liquid firms are less likely to experience financial distress.
- Liquid assets typically earn a lower return
Debt vs Equity
- Creditors are paid first; Shareholders get residual.
- Other term for debt is:
Financial leverage - Cost and benefits of financial leverage (debt) discussed more in later chapters
Market Value vs Book Value
The balance sheet provides the book value of the assets, liabilities, and equity.
Market value is the price at which the assets, liabilities, or equity can actually be bought or sold.

Income Statement
The Income Statement
- Generally: $\text{Revenue}-\text{Expenses}=\text{Income}$
- Net Income $\neq$ cash flow
- GAAP
- Recognition and matching
- Non-cash items: Depreciation
Income Statement: Example
| Revenue | ||
|---|---|---|
| Net Sales | + | 1,509 |
| Expenses | ||
| Cost of Goods Sold | - | 750 |
| Depreciation | - | 65 |
| Earnings Before Interest and Taxes (EBIT) | Revenue - Operating Expenses | 694 |
| Interest Paid | - | 70 |
| Taxable Income | EBIT - Interest Paid | 624 |
| Taxes | Taxable Income $\times$ Tax Rate | 131 |
| Net Income (NI) | Taxable Income - Taxes | 493 |
| Dividends | 293 | |
| Retained Earnings | 200 |
Taxes
- Tax code is complicated
- This isn't a corporate tax class
- Marginal vs average tax rate
What kind of taxes are companies paying?
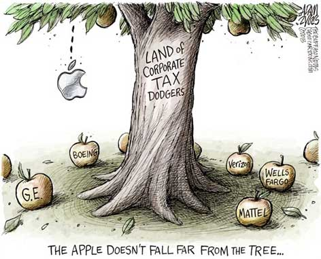
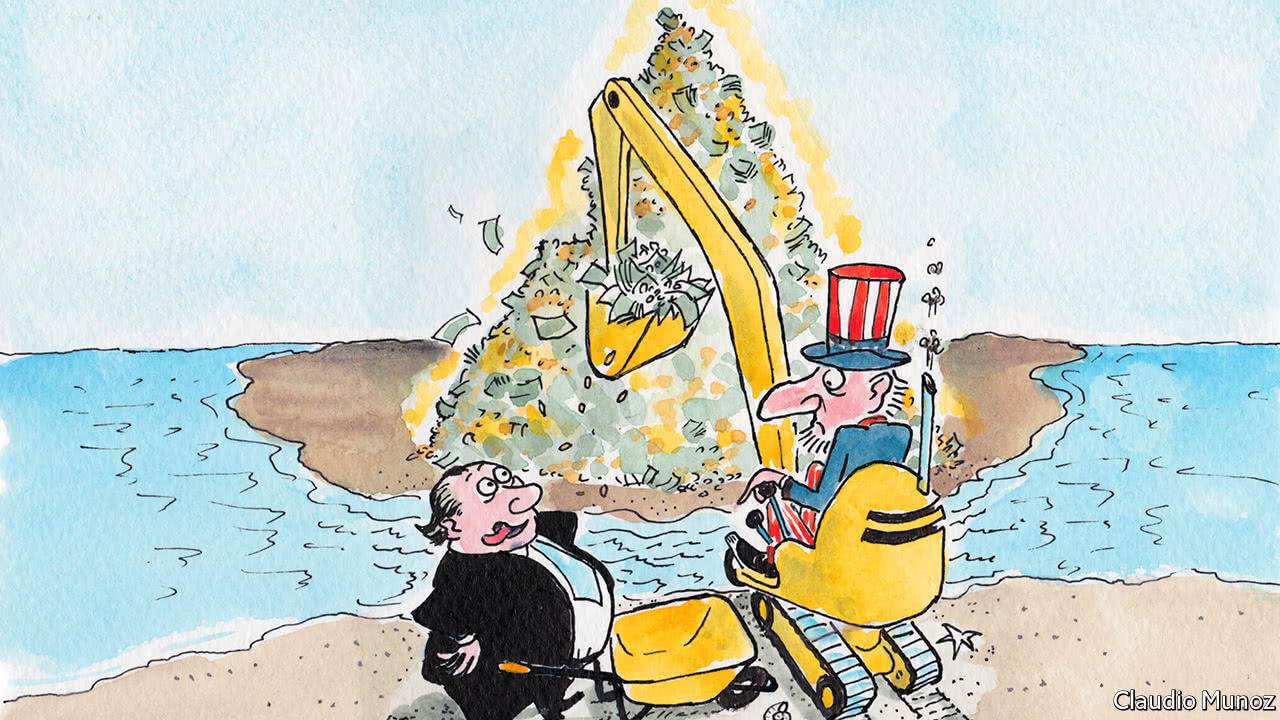
Foreign Earnings
How are foreign earnings taxed?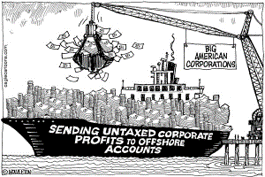
Repatriation and Tax Cuts
Corporate Inversion
What is a corporate inversion?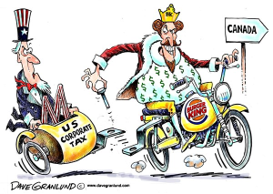
(not)Fun fact: You owe taxes if you own stock in US company even if you don’t sell shares!! (See WSJ article)
Cash Flow
Cash Flow
Cash flow identity:
$\text{Cash flow from assets}=$
$\text{Cash flow to creditors}+\text{Cash flow to stockholders}$
Cash Flow from Assets (CFFA)
$\text{CFFA}=\text{Cash Flow to Creditors}+\text{Cash Flow to Stockholder}$- Known as
free cash flow
$\text{CF}_{\text{Assets}}=\text{OCF}-\text{NCS}-\Delta\text{NWC}$,
where:
$\text{OCF}=\text{Operating Cash Flow}$
$\text{NCS}=\text{Net Capital Spending}$
$\Delta\text{NWC}=\text{Change in Net Working Capital}$
Operating Cash Flow (OCF)
OCF=EBIT +Depreciation-Taxes| Revenue | ||
|---|---|---|
| Net Sales | + | 1,509 |
| Expenses | ||
| Cost of Goods Sold | - | 750 |
| Depreciation | - | 65 |
| Earnings Before Interest and Taxes (EBIT) | Revenue - Operating Expenses | 694 |
| Interest Paid | - | 70 |
| Taxable Income | EBIT - Interest Paid | 624 |
| Taxes | Taxable Income $\times$ Tax Rate | 131 |
| Net Income (NI) | Taxable Income - Taxes | 493 |
Net Capital Spending (NCS)
NCS$_t$=Fixed Assets$_t$-Fixed Assets$_{t-1}$+Depreciation| Assets | 2017 | 2016 | Liabilities | 2017 | 2016 |
|---|---|---|---|---|---|
| Current Assets | Current Liabilities | ||||
| Cash | 1,500 | 1,300 | Accounts Payable | 600 | 800 |
| Accounts Receivable | 500 | 800 | Notes Payable | 300 | 150 |
| Inventory | 750 | 1000 | |||
| Total | 2,750 | 3,100 | Total | 900 | 950 |
| Fixed Assets | |||||
| Property Plant and Equipment | 5,000 | 4,500 | Long-term Debt | 3,500 | 3,200 |
NCS=5000-4500+65=565
Change in Net Working Capital($\Delta$NWC)
NWC$_t$=Current Assets$_t$ - Current Liabilities$_t$$\Delta$NWC$_t$=NWC$_t$-NWC$_{t-1}$
| Assets | 2017 | 2016 | Liabilities | 2017 | 2016 |
|---|---|---|---|---|---|
| Current Assets | Current Liabilities | ||||
| Cash | 1,500 | 1,300 | Accounts Payable | 600 | 800 |
| Accounts Receivable | 500 | 800 | Notes Payable | 300 | 150 |
| Inventory | 750 | 1000 | |||
| Total | 2,750 | 3,100 | Total | 900 | 950 |
| Fixed Assets | |||||
| Property Plant and Equipment | 5,000 | 4,500 | Long-term Debt | 3,500 | 3,200 |
$\Delta$NWC=(2,750-900)-(3,100-950)=-300
Cash Flow From Assets
CFFA=Cash Flow to Creditors+Cash Flow to StockholderCF$_{Assets}$=OCF-NCS-$\Delta$NWC
CF$_{Assets}$=628-565-(-300)=363
Cash Flow to Creditors
CFFA=Cash Flow to Creditors+Cash Flow to StockholderCF$_{Creditors}$=Interest Paid - Net New Borrowing
CF$_{Creditors}$=Interest Paid - (Long Term Debt$_t$ - Long term Debt$_{t-1}$)
| Balance Sheet | Income Statement | ||||
|---|---|---|---|---|---|
| Liabilities | 2017 | 2016 | Net Sales | 1509 | |
| Current Liabilities | Cost of Goods Sold | 750 | |||
| Accounts Payable | 600 | 800 | Depreciation | 65 | |
| Notes Payable | 300 | 150 | EBIT | 694 | |
| Interest paid | 70 | ||||
| Total | 900 | 950 | Taxable Income | 624 | |
| Taxes | 131 | ||||
| Long-term Debt | 3,500 | 3,200 | Net Income | 493 |
CF$_{Creditors}$=70-(3,500-3,200)=-230
Cash Flow to Shareholders
CFFA=Cash Flow to Creditors+Cash Flow to StockholderCF$_{Stockholders}$=Dividends Paid-Net New Equity Issuance
CF$_{Stockholders}$=Dividends Paid-(Common Stock$_t$ - Common Stock$_{t-1}$)
| Balance Sheet | Income Statement | ||||
|---|---|---|---|---|---|
| 2017 | 2016 | EBIT | 694 | ||
| Shareholder's Equity | Interest paid | 70 | |||
| Common Stock | 1,000 | 1,300 | Taxable Income | 624 | |
| Retained Earnings | 2,350 | 2,150 | Taxes | 131 | |
| Total | 3,350 | 3,450 | Net Income | 493 | |
| Dividends | 293 | ||||
| Retained Earnings | 200 |
CF$_{Stockholders}$=293-(1,000-1,300)=593
Does it balance?
CFFA=Cash Flow to Creditors+Cash Flow to StockholderCF$_{Assets}$=363
CF$_{Creditors}$=-230
CF$_{Stockholders}$=593
$363=-230+593$
$363=363$
Summary
Cash Flow IdentityCF$_{Assets}$=CF$_{Stockholders}$+CF$_{Creditors}$
Cash Flow from Assets
CF$_{Assets}$=OCF-NCS-$\Delta$NWC, where:
OCF=EBIT+Depreciation-Taxes
NCS=Net Fixed Assets$_t$-Net Fixed Assets$_{t-1}$+Depreciation
$\Delta$NWC=NWC$_t$-NWC$_{t-1}$=(CA$_t$-CL$_t$)-(CA$_{t-1}$-CL$_{t-1}$)
Cash Flow to Creditors
CF$_{Creditors}$=Interest Paid-Net New Borrowing=Interest Paid-(Long Term Debt$_t$-Long Term Debt$_{t-1})$
Cash Flow to Stockholders
CF$_{Stockholders}$=Dividends Paid-Net New Equity Raised =Dividends Paid-(Common Stock$_t$-Common Stock$_{t-1}$)
Cash Flow Problem
Sales=600CGS=300
Depreciation=150
Interest=30
Taxes=21% (round to nearest integer)
Dividends=30
Beg NFA=500 End NFA=750, NFA=Net Fixed Assets
Beg CA=2130 End CA=2260 Beg CL=1620 End CL=1710
No new equity
What is CF to creditor and net new borrowing?
CF$_C$=-195 Net New Borrowing=225
Sources of Financial Information
- Financial information is abundant and readily accessible.
- The following are some common sources:
- Annual reports (often on company websites)
- SEC EDGAR
- Any required reporting for public companies can be found here
- NYSE
- NASDAQ
- Yahoo Finance
- Seeking Alpha
- Wall Street Journal
- Bloomberg
Key Learning Outcomes
- Reading financial statements
- Differentiate: book vs market; financial vs accounting
- Corporate Taxes and Foreign Earnings
- Understand and calculate cash flows